MACD
The Moving Average Convergence Divergence (MACD) technical indicator is a popular trend prediction tool which provides an indication of a bull or bear inflection point.
MACD consists of three key parameters, namely the slow, fast periods and the signal lines. The MACD line is formed by subtracting the value of the slow period from a fast period. The standard is 26 for the slow period and 12 for the fast period.
Determining the Trends
Traders often make use of the crossover between the MACD and Signal line to determine if the market is heading into a bullish or bearish phase.
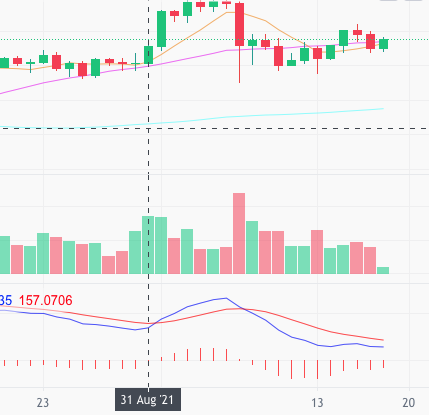
If the MACD line crosses the Signal line from below to above, it is generally considered bullish.
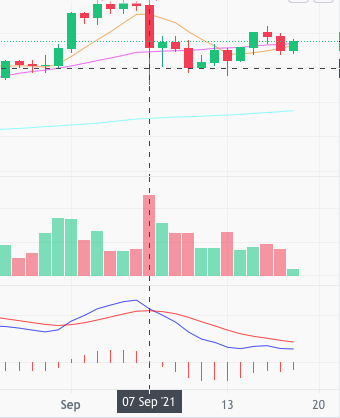
If the MACD line crosses the Signal line from above to below, it is generally considered bearish.
The crossovers are often triggers for traders to enter or exit a position.

From the graph above, we can see that the MACD line (blue line) crosses the signal line (red line) on or near Aug 31, 2021. The following few days resulted in a bullish uptrend for the stock.

For the same stock, the previous bullish trend turned around to a bearish trend on Sep 7. As the chart shows, the MACD line has dropped from above to below the Signal line.
For seasoned traders, ForexHero offers the ability for them to configure the specific values for the fast and slow periods as well as the signal line period.
Last updated